BHAVISHYAT™ Trading Indicator | Multi-Market Trading & Risk Management Engine
BHAVISHYAT™: An Adaptive Multi-Market Trading & Risk-Management Engine
One Engine. Multiple Markets. Multiple Timeframes.
Financial markets may look completely different on the surface.
NIFTY moves differently from Bitcoin. Gold behaves differently from the NASDAQ. The U.S. Dollar Index has a different volatility profile from individual stocks, commodities or cryptocurrencies.
Yet beneath these differences lies a fundamental question:
Can one systematic framework identify meaningful market structure, respond to changing market conditions and manage a trade across different assets and timeframes?
This question became the foundation for BHAVISHYAT™, an adaptive multi-market trading and risk-management engine developed through the research initiatives of NEXGEN TRADING ACADEMY.
BHAVISHYAT has not been designed merely to place BUY and SELL labels on a chart.
The broader objective is to create a structured decision-support framework that can follow a market opportunity from signal identification to trade management, risk control, target progression and changing market conditions.
Why We Developed BHAVISHYAT
One of the biggest challenges traders face is not the absence of indicators.
It is the abundance of them.
A trader may use one indicator for momentum, another for trend, another for entry, another for exit and yet another for risk management.
The result can often be conflicting information.
A BUY signal may appear from one indicator while another suggests weakness. A trader enters, but then faces an even more difficult question:
What happens after the entry?
Where should risk be controlled?
When should profits be protected?
Should the trader continue holding?
Has the market structure changed?
Is a new opportunity developing?
These questions encouraged us to approach BHAVISHYAT as more than a conventional signal-generating indicator.
The objective was to develop a structured trading engine capable of integrating signal generation with systematic trade-management logic.
From Signal Generation to Trade Management
BHAVISHYAT is designed around the concept that identifying an opportunity is only the beginning of a trading process.
Depending on the selected engine and configuration, its architecture can incorporate:
- BUY and SELL signal identification
- Re-entry logic
- Progressive target management
- TP1 through TP6 target architecture
- Dynamic trade-protection mechanisms
- Risk-management logic
- Wave Shift identification
- Multi-timeframe operation
- Automated TradingView alerts and notifications
- Historical trade visualization
The objective is to provide traders with a more structured view of the complete lifecycle of a market setup.
TP1–TP6: Managing the Journey After Entry
Markets rarely move from entry to final objective in a perfectly straight line.
For this reason, BHAVISHYAT incorporates a progressive target architecture.
Depending upon the operating model, a trade may progress through:
TP1 → TP2 → TP3 → TP4 → TP5 → TP6
Rather than treating every target simply as another prediction, the target ladder is designed to help the engine interpret how far a market movement has progressed.
This allows trade management to evolve as the movement develops.
The underlying philosophy is simple:
Finding an entry is important. Managing what happens after the entry is equally important.
Introducing Wave Shift
Markets change character.
A trend that appeared strong can weaken. A corrective movement can evolve into something larger. Momentum can change and the previous directional assumption may no longer remain appropriate.
This created another important research problem:
How should a trading system respond when the behaviour of the market changes after a trade has already developed?
BHAVISHYAT's Wave Shift architecture was developed as part of our research into this problem.
Wave Shift is a downstream trade-management mechanism designed to evaluate specific changes in market behaviour after qualifying conditions have occurred.
Where the relevant conditions are satisfied, the system can identify a potential directional transition and manage the subsequent opportunity according to its defined rules.
This makes BHAVISHYAT fundamentally different from a static BUY/SELL label generator.
One Framework Across Multiple Markets
A central research objective behind BHAVISHYAT has been cross-market adaptability.
We have studied its behaviour across different asset classes, including:
Indian Markets
NIFTY, BANK NIFTY and other equity-market instruments.
Global Equity Markets
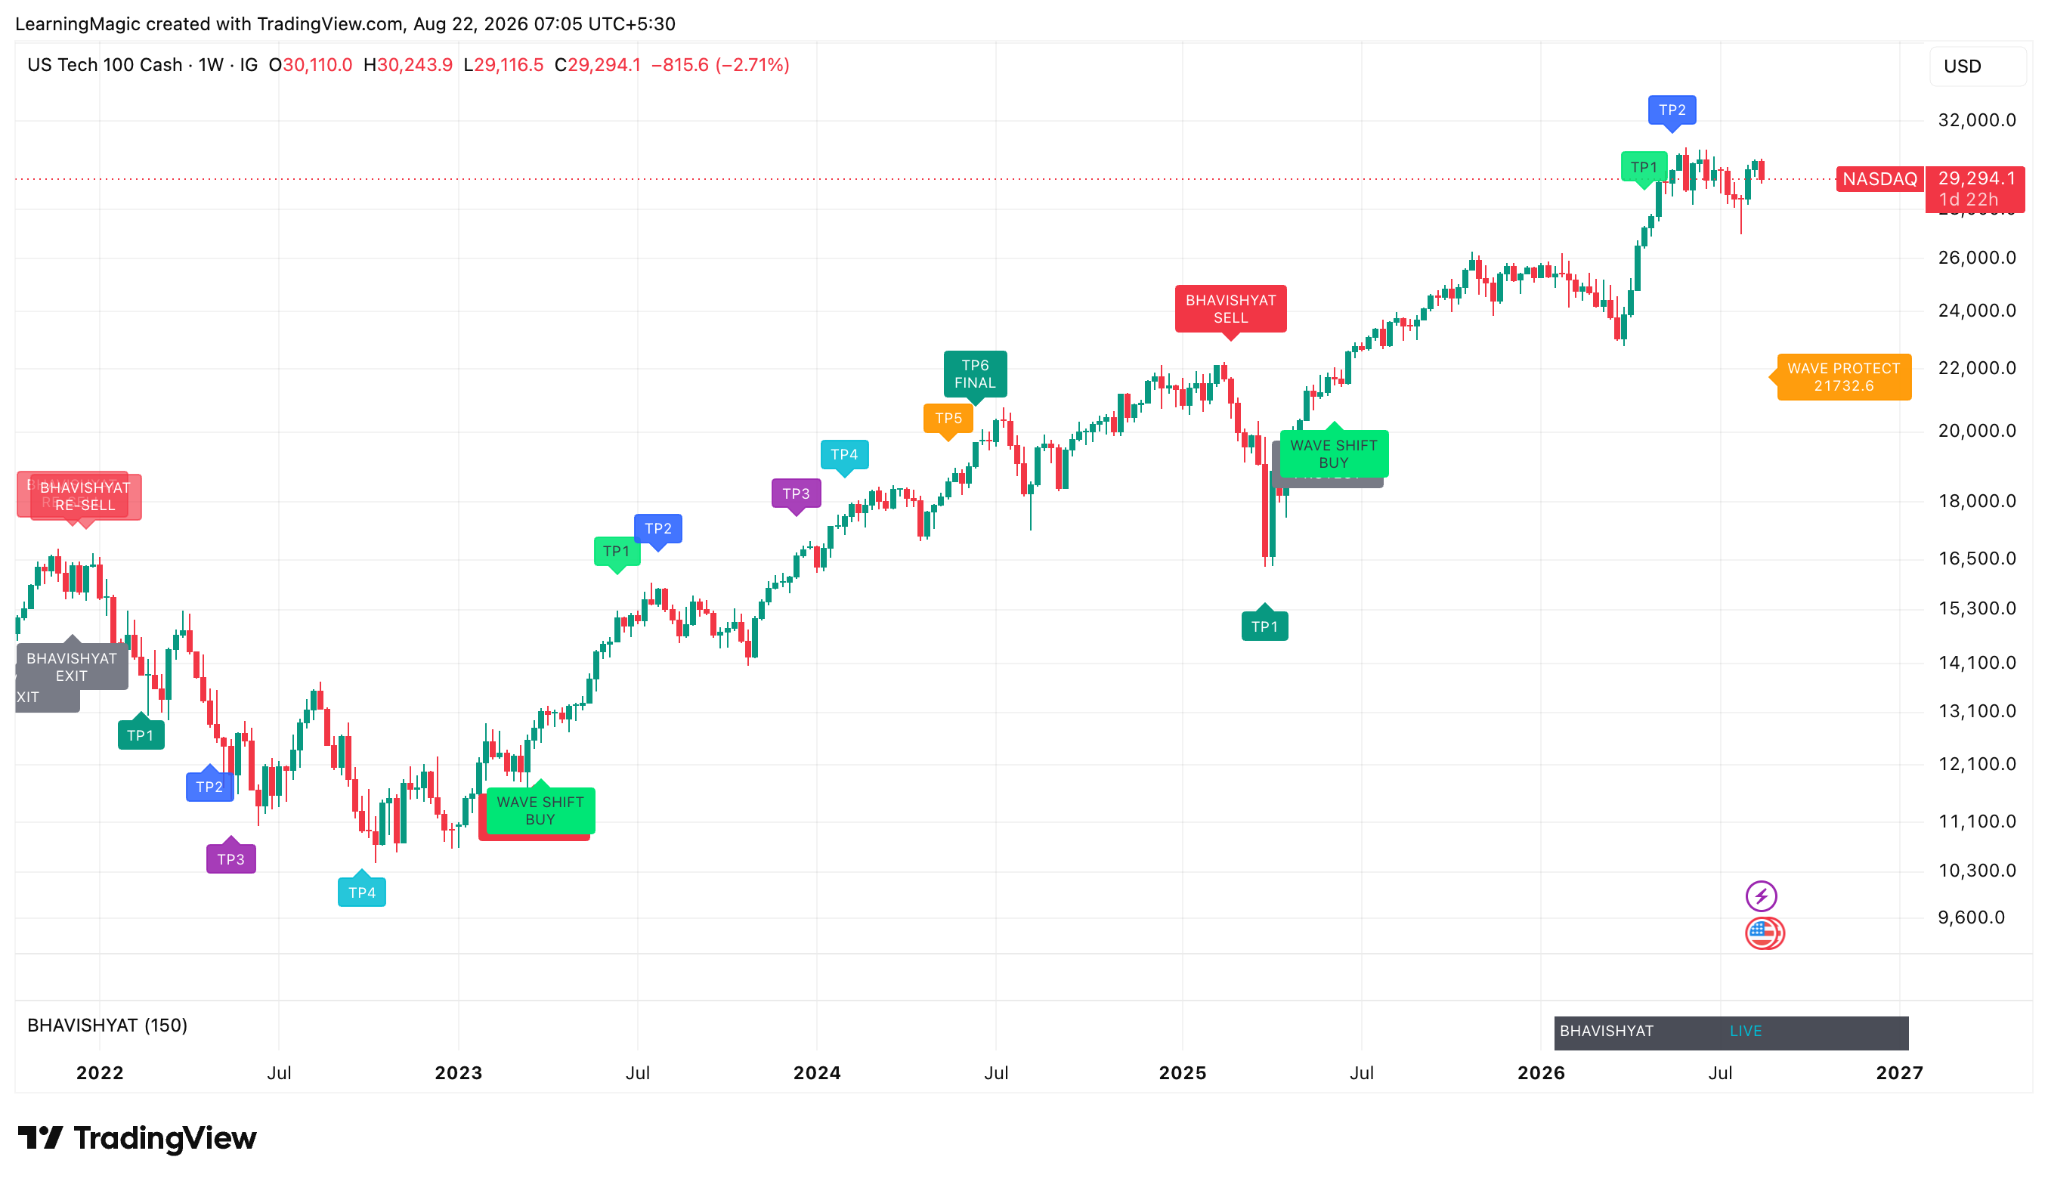
NASDAQ and other major indices.
Commodities
Gold, Silver and other commodity markets.
Forex & Currency Markets
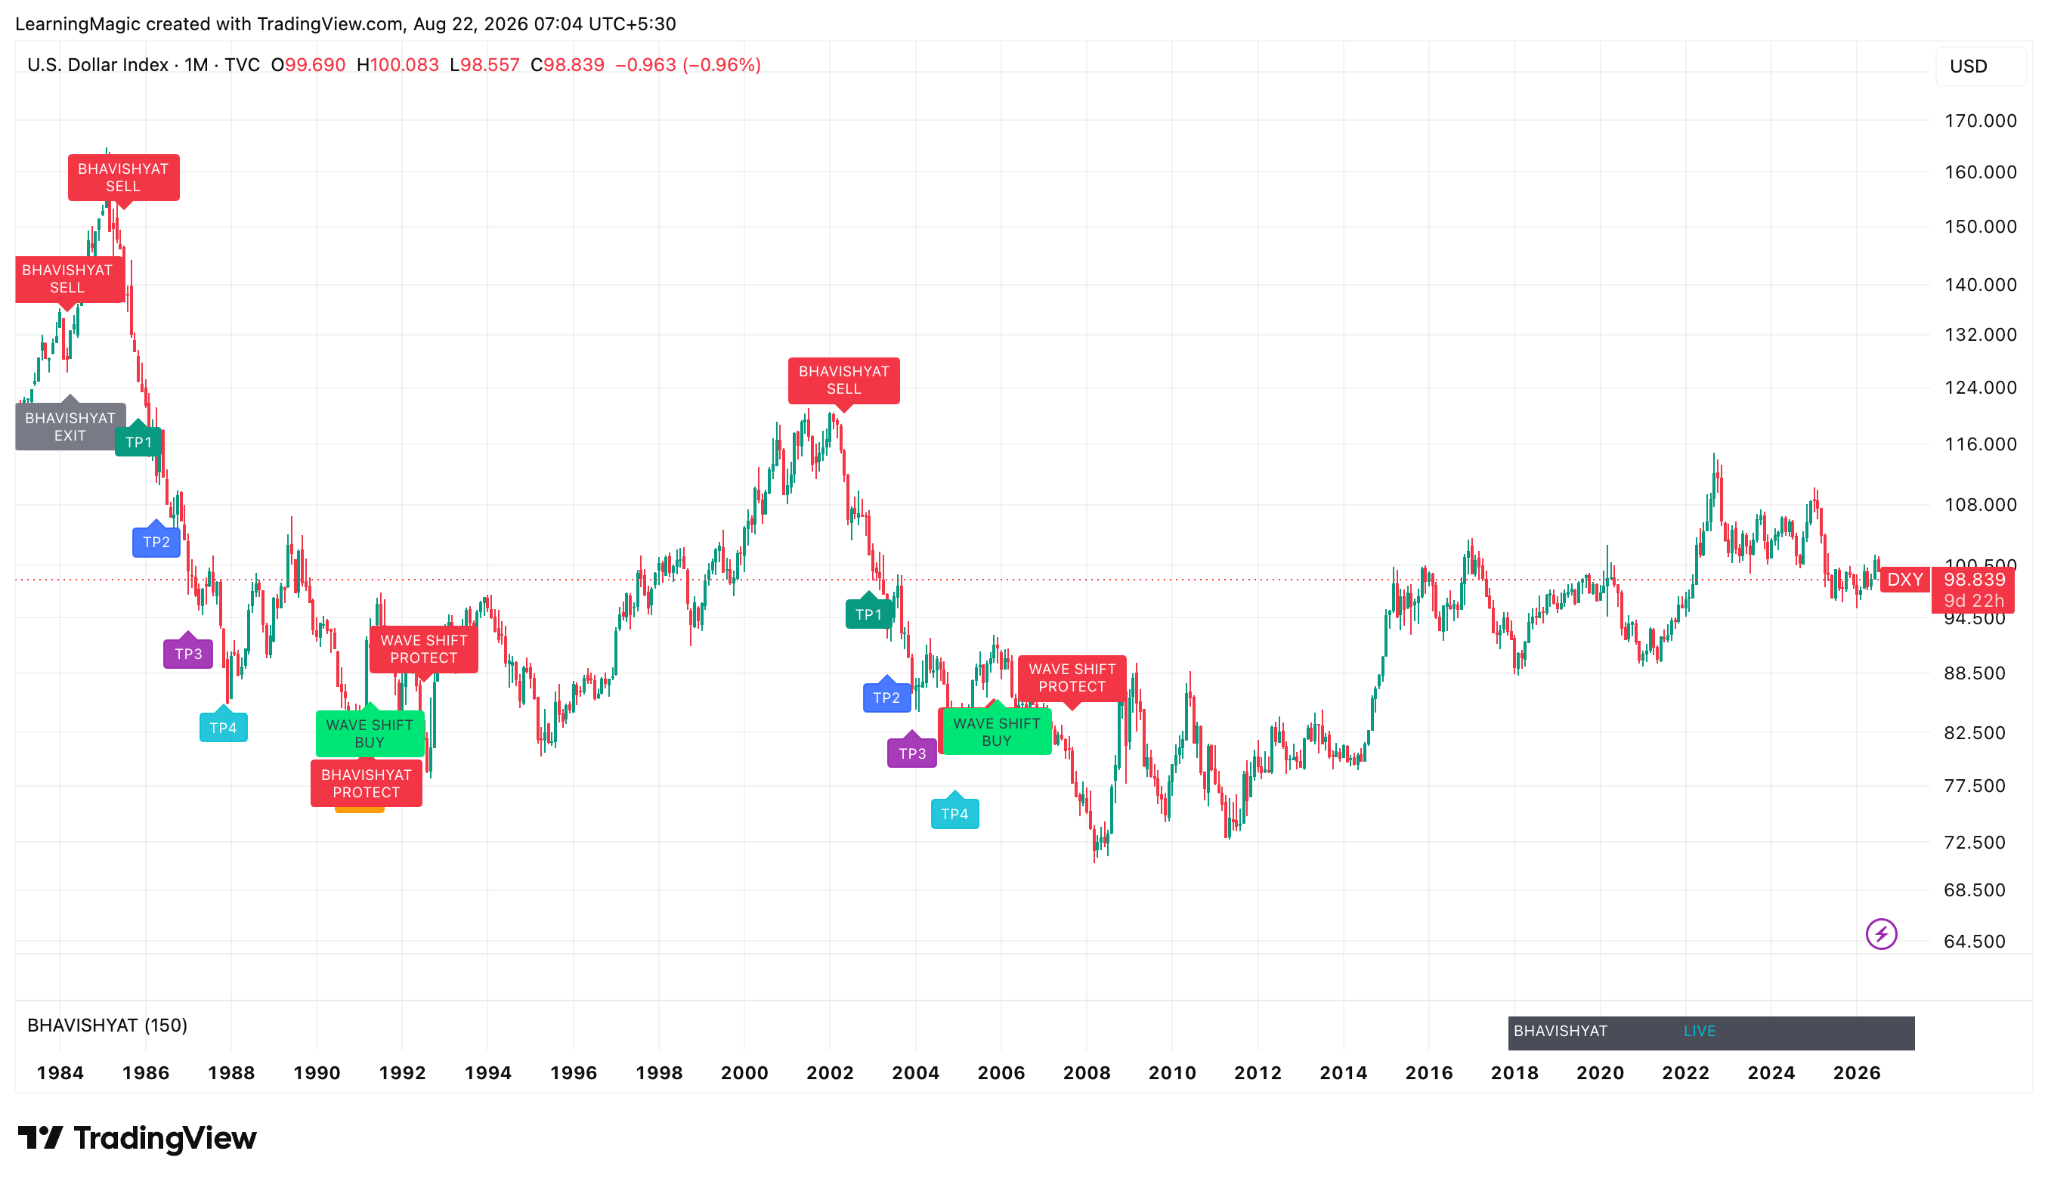
Currency pairs and macro instruments such as the U.S. Dollar Index.
Cryptocurrency
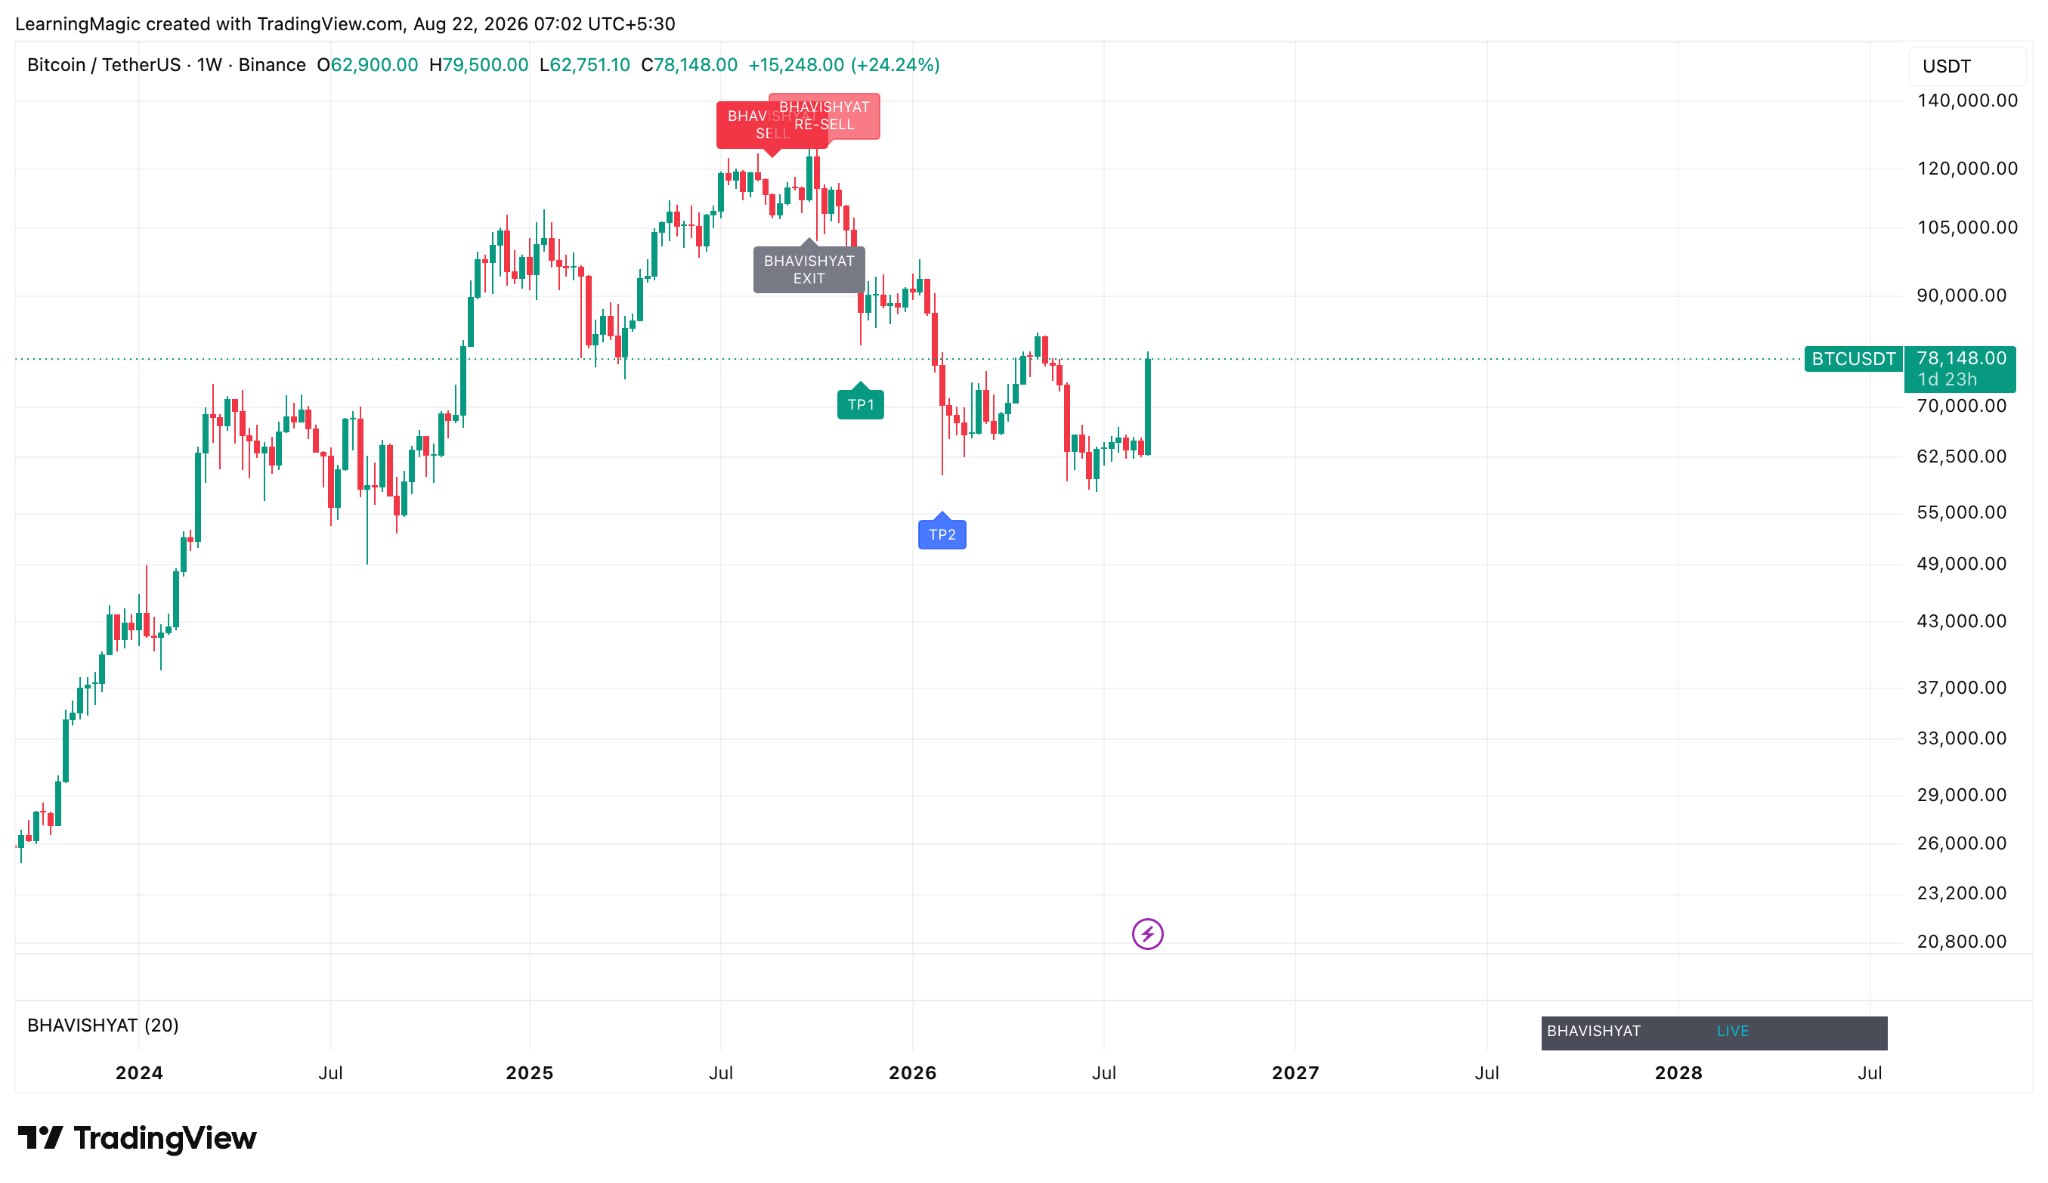
Bitcoin, Ethereum and other actively traded digital assets.
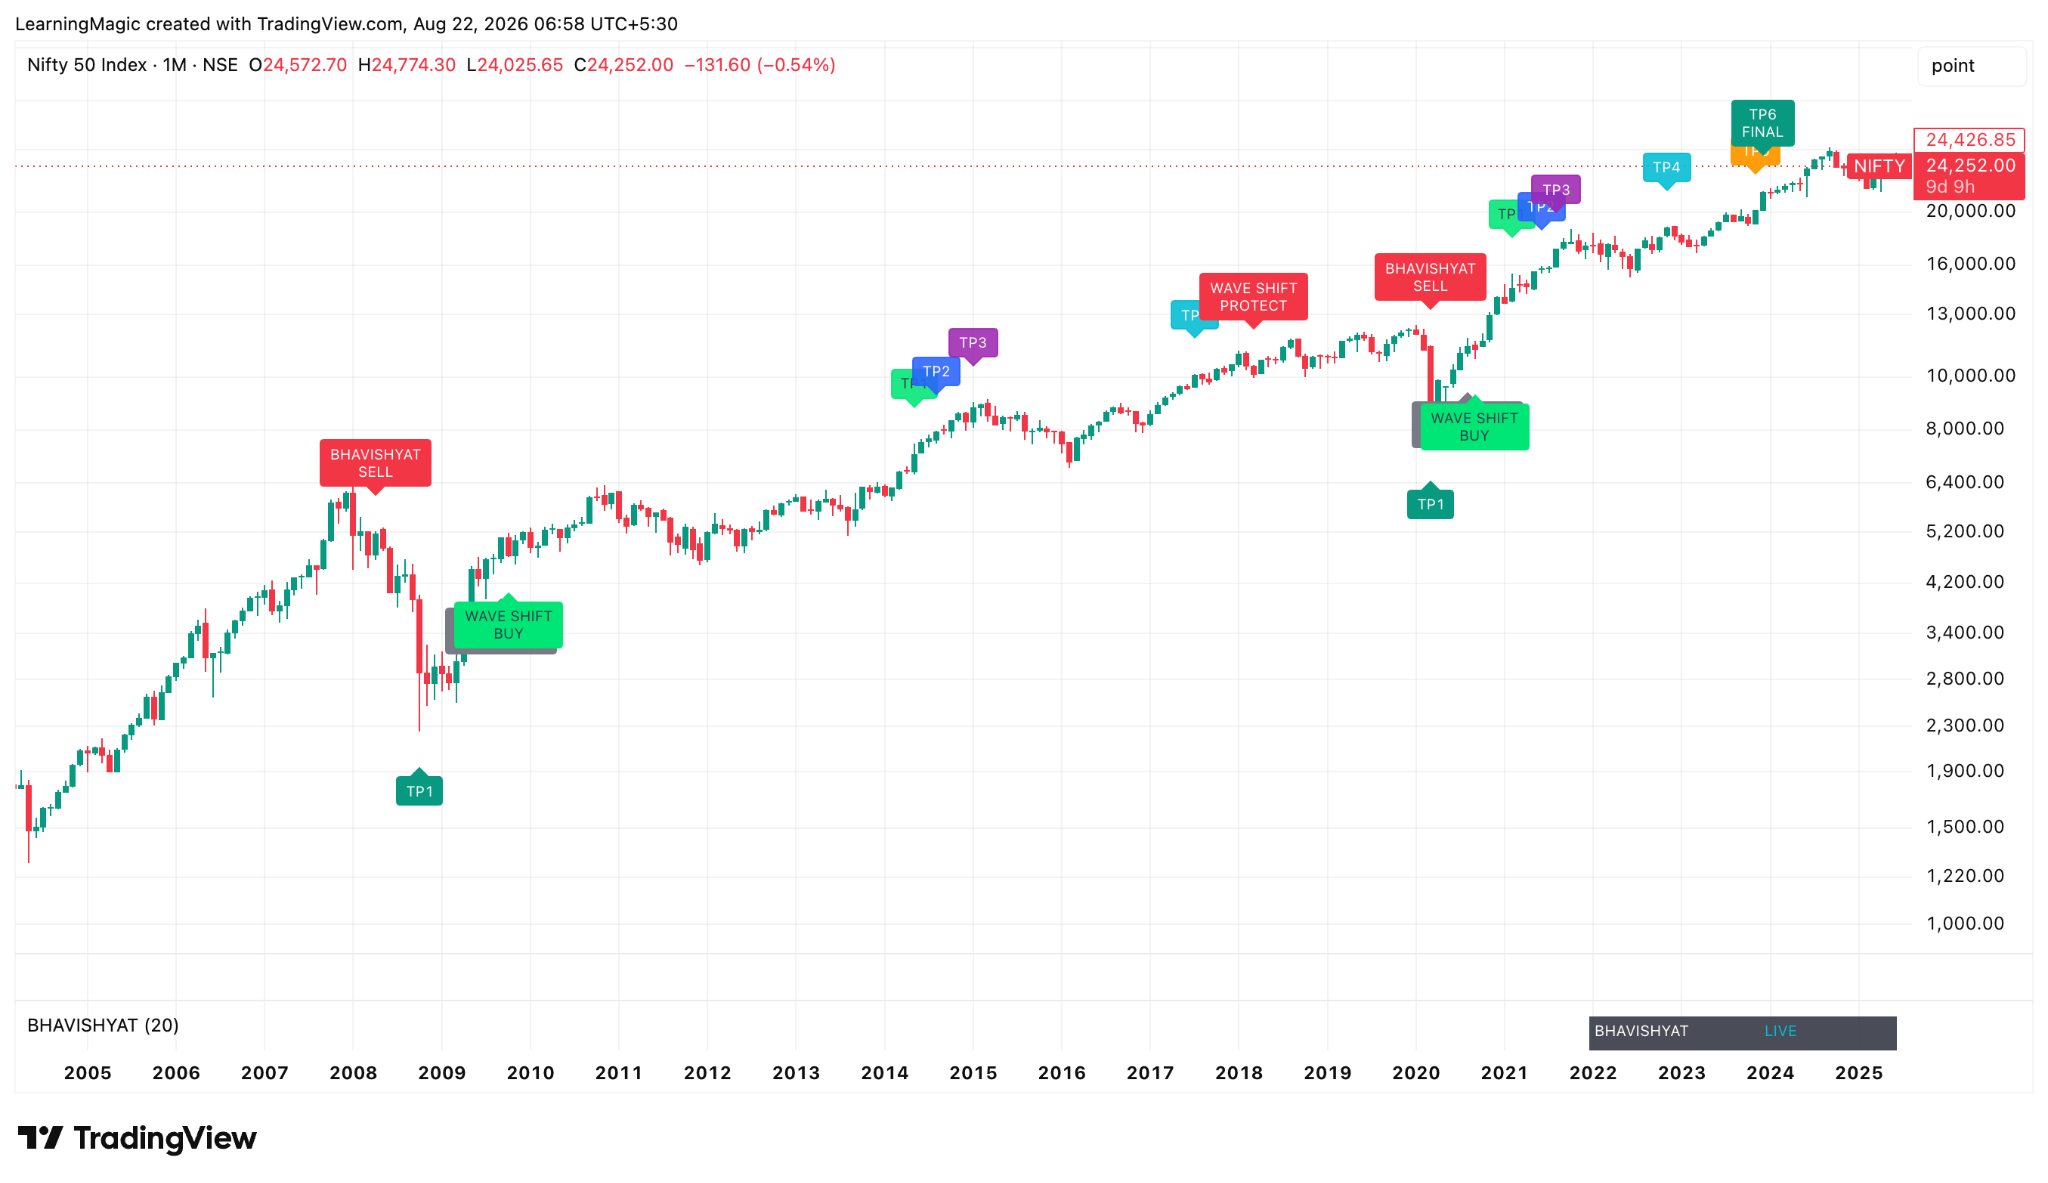
The accompanying historical TradingView charts illustrate examples of BHAVISHYAT operating on NIFTY, NASDAQ, DXY and Bitcoin.
These assets differ considerably in volatility, market participants, trading hours and macroeconomic influences.
The research challenge is therefore not simply whether BHAVISHYAT can produce a signal on each chart.
The more important question is:
Can the underlying framework remain structurally consistent when the market itself changes?
That remains one of the principal areas of our continuing research.
Multiple Timeframes Without Rebuilding the Entire Framework
A strategy that appears effective on a five-minute chart may behave very differently on a daily, weekly or monthly chart.
BHAVISHYAT has therefore been developed with multi-timeframe adaptability as an important design objective.
Depending upon the instrument and selected engine, the framework can be studied across intraday as well as higher timeframes.
This allows traders and researchers to investigate BHAVISHYAT from different perspectives—from shorter-term market movements to major structural market cycles.
The objective is not to suggest that every market or timeframe behaves identically.
Rather, it is to develop an architecture capable of adapting its decision-making framework without requiring the trader to assemble an entirely different collection of indicators for every chart.
Historical Examples Across Decades
One of the most interesting aspects of our research has been examining BHAVISHYAT on long-term historical charts.
For example, applying the framework to monthly charts allows researchers to observe its behaviour through substantially different economic and market environments.
Such charts can include periods of:
- strong bull markets
- major corrections
- prolonged consolidations
- volatility expansions
- macroeconomic transitions
- liquidity cycles
- structural market reversals
Long-term historical visualization therefore provides an important research environment for evaluating how a framework behaves when market conditions change substantially.
However, historical observations must always be interpreted carefully.
Historical behaviour does not guarantee that the same outcome will occur in the future.
BHAVISHYAT Is Not About Predicting Every Candle
No responsible trading framework should be presented as capable of predicting every market movement.
Markets contain uncertainty.
False signals can occur. Stop-losses can occur. Market structures can change unexpectedly. Volatility can increase dramatically, and future market behaviour can differ from historical patterns.
BHAVISHYAT is therefore better understood as a systematic decision-support and trade-management framework, rather than a promise of certainty.
Its objective is to bring greater structure to questions such as:
When might a qualifying opportunity be developing?
When has a trade progressed sufficiently to begin managing targets?
When should risk be protected?
When has the original market behaviour potentially changed?
This distinction is fundamental to our research philosophy.
Research Before Marketing
At NEXGEN Trading Academy, we believe that a trading system should be researched across multiple market environments before conclusions are drawn from a handful of attractive charts.
For that reason, development of BHAVISHYAT has involved continuous experimentation with:
Market Structure + Momentum Behaviour + Risk Management + Target Progression + Multi-Timeframe Analysis + Adaptive Trade Management
The system continues to evolve as additional market data and different market environments are studied.
Rather than claiming that development has reached a final destination, we view BHAVISHYAT as an ongoing research project.
Built for Traders Who Want Structure
BHAVISHYAT may be particularly relevant to traders who want a systematic framework instead of continuously switching between unrelated indicators.
Its design philosophy emphasizes:
Clarity over clutter.
Structure over impulse.
Risk management over prediction alone.
Process over emotion.
Technology cannot eliminate market risk, and no indicator can replace trader discipline.
But technology can potentially help traders apply a defined process more consistently.
That is the problem BHAVISHYAT has been designed to explore.
Automated Alerts — Stay Connected to the Market
A trader cannot continuously watch every chart.
BHAVISHYAT can work with the TradingView alert ecosystem to help users receive notifications when defined conditions occur.
Depending upon the configured implementation, alerts can be delivered through supported TradingView notification channels, helping traders monitor relevant market developments without continuously staring at the screen.
The purpose of automation is not to remove human judgment.
It is to reduce the burden of continuous manual monitoring.
The Philosophy Behind BHAVISHYAT
BHAVISHYAT ultimately reflects a broader philosophy that has guided much of the research at NEXGEN Trading Academy:
Markets should be studied as evolving structures—not isolated candles.
Price movement, momentum, structure, time and risk are interconnected.
A sophisticated trading framework should therefore attempt to understand not only where the market is, but also how the current movement is developing and how risk should be managed as that movement evolves.
This philosophy has shaped the continuing development of BHAVISHYAT.
BHAVISHYAT™
One Engine. Multiple Markets. Multiple Timeframes.
From NIFTY to NASDAQ.
From Gold and Silver to Forex.
From traditional financial markets to Bitcoin and cryptocurrency.
BHAVISHYAT represents our continuing effort to develop an adaptive framework capable of studying different markets through a common systematic architecture.
And the research continues.
Experience BHAVISHYAT
Traders, students and market participants interested in understanding BHAVISHYAT can connect with NEXGEN TRADING ACADEMY for information regarding product demonstrations, availability and educational sessions.
NEXGEN TRADING ACADEMY
Your Next Step to Financial Freedom
Website: www.elliottneo.com
Important Disclaimer
BHAVISHYAT is a technical-analysis and decision-support tool. Information, signals, charts, targets, alerts and historical examples presented in connection with BHAVISHYAT are intended for educational, research and informational purposes and should not be interpreted as guaranteed investment returns.
Historical signals, back-tested observations and past market behaviour do not guarantee future performance. Financial markets involve risk, including the potential loss of capital. Users should independently evaluate their financial circumstances, risk tolerance and applicable regulatory requirements before making trading or investment decisions.
The charts displayed in this article are historical TradingView examples intended to demonstrate the behaviour of the framework under selected market conditions. They should not be interpreted as a representation that identical results will occur in future market conditions.